


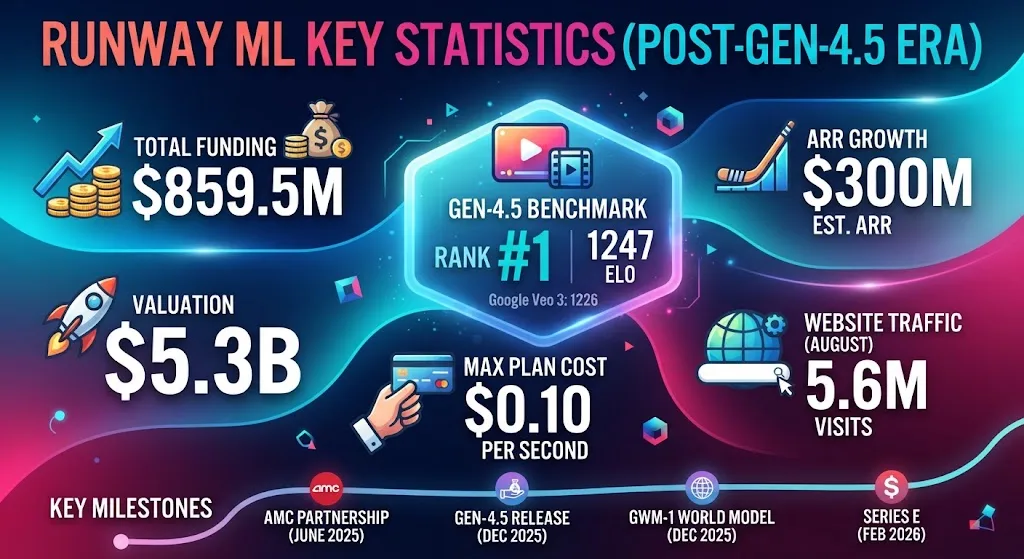
Runway closed a $315 million Series E on 10 February 2026 at a $5.3 billion post-money valuation, ten weeks after its Gen-4.5 model took the top spot on the Artificial Analysis text-to-video leaderboard. These Runway ML statistics cover the funding record, revenue estimates, model benchmarks, pricing arithmetic and search footprint behind that position, using figures published from 2024 onward.
Key Runway ML statistics for 2026
Runway raised $315 million in its Series E at a $5.3 billion post-money valuation.
Total funding stands at $859.5 million across 7 rounds.
The company added $40 million in annual recurring revenue during Q2 2026 alone.
Gen-4.5 scored 1,247 Elo on the Artificial Analysis text-to-video benchmark, ahead of Google Veo 3 at 1,226.
runwayml.com drew roughly 5.6 million visits in August 2026.
The domain earns 357,419 organic search visits a month from 820 ranking keywords.
Runway ML funding statistics and valuation history
| Metric | Figure |
| Series D valuation (April 2025) | Over $3 billion |
| Series E amount (10 February 2026) | $315 million |
| Series E post-money valuation | $5.3 billion |
| Total funding raised | $859.5 million |
| Funding rounds completed | 7 |
| Year founded | 2018 |
The Series E alone accounts for 36.7% of every dollar Runway has raised since 2018, which tells you how much of the capital arrived in the last twelve months. Valuation rose about 77% between April 2025 and February 2026. General Atlantic led the round, with Nvidia, AMD Ventures, Adobe Ventures, Fidelity Management & Research, AllianceBernstein, Mirae Asset, Felicis and Premji Invest participating. Two chip makers on one cap table is unusual.
Runway ML revenue statistics and ARR growth
| Period | Revenue measure | Figure |
| 2024 | Estimated ARR | $121.6 million |
| 2024 | Recognized revenue | About $44 million |
| 2024 | EBITDA loss | $155 million |
| 2025 | Estimated ARR | $300 million |
| Q2 2026 | New ARR added in the quarter | $40 million |
The gap between $121.6 million and $44 million for the same year is a measurement difference rather than a contradiction: the first annualizes the December run rate, the second is revenue actually booked across twelve months. Growth from $121.6 million to $300 million works out at 146.7% year on year. The Q2 2026 addition of $40 million is 13.3% of that $300 million base, so holding that quarterly pace for a year produces $160 million of net new ARR and roughly 53% growth, a clear deceleration from the prior year even in absolute dollars. At $300 million ARR the $5.3 billion valuation prices the company at about 17.7 times revenue. The 2024 EBITDA loss ran 3.5 times recognized revenue, which is the compute bill behind training these models.
Runway Gen-4.5 benchmark statistics against Veo, Kling and Sora
| Model | Artificial Analysis text-to-video Elo | Rank |
| Runway Gen-4.5 | 1,247 | 1 |
| Google Veo 3 | 1,226 | 2 |
| Kling 2.5 | 1,225 | 3 |
| OpenAI Sora 2 Pro | 1,206 | 4 |
A 21-point Elo lead converts to an expected head-to-head preference rate of about 53%, so Gen-4.5 wins a blind comparison against Veo 3 slightly more often than it loses. The whole leaderboard spans 41 points from first to fourth, and Veo 3 and Kling 2.5 sit one point apart, close enough to be a tie. Runway published the model’s failure modes alongside the score, naming causal reasoning, object permanence and success bias as open problems. Ten days later the company shipped GWM-1, a world model running at 720p in real time and producing up to two minutes of video across three post-trained variants for environments, avatars and robotics. Smaller image-to-video tools such as MotionMuse AI still cap output at four to six seconds.
Runway ML pricing statistics and cost per second of video
| Plan | Annual billing | Monthly billing | Credits per month | Gen-4.5 seconds | Cost per second |
| Free | $0 | $0 | 125 one-time | 10 | n/a |
| Standard | $12 | $15 | 625 | 52 | $0.23 |
| Pro | $28 | $35 | 2,250 | 187 | $0.15 |
| Max | $76 | $95 | 9,500 | 791 | $0.10 |
Cost per second of Gen-4.5 output falls 58% moving from Standard to Max. Max supplies 15.2 times the credits of Standard for 6.3 times the price, so the discount is concentrated at the top rather than spread evenly across tiers. Monthly billing carries exactly a 25% premium over annual on all three paid plans, which is a flat penalty rather than a tiered one. Switching to Gen-4 Turbo at 5 credits per second stretches a Standard allowance from 52 seconds to 125, so a free model swap buys 2.4 times more output where the Standard to Pro upgrade buys 3.6 times more for 2.3 times the money. Credit-metered billing of this kind is now standard across AI creative tools, from Remaker AI to ad generators such as Zeely and chat products like Gening AI.
Runway ML website traffic statistics for 2026
| Metric | Figure |
| Monthly visits, August 2026 | About 5.6 million |
| Month-on-month change | Down 8.02% |
| Global website rank | 7,435 |
| Bounce rate | 30.58% |
| Pages per visit | 7.56 |
| Average visit duration | 6 minutes 35 seconds |
| Direct traffic share | 41.14% |
Sessions average 52 seconds per page across 7.56 pages, a pattern that fits render-and-wait workflows rather than browsing. A 30.58% bounce rate is low for a tool site and pairs with the 41.14% direct share to suggest most arrivals are returning account holders typing the domain, not first-time searchers. The 8.02% monthly decline matters more than the raw total: it lands in the same period as the Q2 2026 ARR gain, so paid usage grew while site visits fell.
Runway ML organic search statistics by country
| Country | Monthly organic visits | Share of organic traffic | Ranking keywords |
| India | 102,529 | 28.7% | 299 |
| Indonesia | 29,398 | 8.2% | 39 |
| Pakistan | 25,886 | 7.2% | 63 |
| United States | 23,880 | 6.7% | 517 |
| Brazil | 13,807 | 3.9% | 112 |
India returns 343 visits per ranking keyword against 46 for the United States, a 7.5x efficiency gap on a keyword set that is 42% smaller. The US ranks for 517 terms, more than any other market, yet converts them into fourth place by organic volume. Similarweb puts the United States first by total visits at 23.13% while search alone places it fourth, and the two readings agree once you separate the channels: American users arrive direct, developing markets arrive through Google. Organic traffic is worth $67,517 a month, or 19 cents per visit, against an estimated $350 of paid search spend for 1,173 clicks. Paid clicks equal 0.33% of organic volume. Runway ranks in the top three for 74.6% of the keywords it ranks for at all, which is what a strong brand term looks like in the data rather than broad topical coverage.
Runway ML studio partnership timeline
| Date | Event |
| 4 June 2025 | AMC Networks signs non-exclusive deal for marketing images and previsualization |
| 1 December 2025 | Gen-4.5 released |
| 11 December 2025 | GWM-1 world model released |
| 10 February 2026 | $315 million Series E at $5.3 billion |
| 11 June 2026 | Lionsgate takes a non-cash equity stake |
Both studio arrangements are structured without disclosed cash payments, and the Lionsgate stake is explicitly not a cash investment. The Lionsgate relationship began in September 2024 and took 21 months to convert into equity. Two model launches ten days apart landed in the ten weeks before the Series E, and the round closed at 17.7 times the prior year’s ARR estimate.
